

Have your servers or websites ever gone down without you noticing? Worried about losing customers because you can’t react to a failure fast enough?
We have the perfect solution for you. Uptime Kuma is an open-source monitoring tool that keeps you one step ahead. From a modern interface you can track the status of your services and get alerts before a problem escalates. Best of all: installing it with Docker takes less time than making a cup of coffee.
If you don’t have Docker installed, no problem: take a look at our complete guide to installing Docker and Docker Compose. Once that’s done, you’re one command away from monitoring your systems.
Why Should You Choose Uptime Kuma?

Before we dive into the technical details, here are a few reasons why Uptime Kuma belongs in your toolkit:
- Keep everything under control: Monitor your servers, websites and services 24/7.
- Friendly interface: You don’t need to be a tech expert to use it.
- Real-time alerts: Set up notifications on platforms like Telegram, Slack or email.
- Open source and free: Customize it however you want without worrying about hidden costs.
- Efficient performance: Great even on hardware with limited resources.
Ready to install it? Let’s get to it.
Prerequisites
Before you start, make sure you have the following:
- Docker: If you haven’t set it up yet, check our earlier article on how to install Docker.
- Linux: A distribution such as Ubuntu 20.04/22.04 or Debian 10/11.
- sudo privileges: You’ll need superuser access to install packages and configure Docker.
- Internet connection: To download the packages you need.
Steps to Install Uptime Kuma with Docker

Step 1: Update Your System
Before installing anything, make sure everything on your system is up to date:
sudo apt update && sudo apt upgrade -yThis keeps you clear of compatibility problems between packages.
Step 2: Install curl (if you don’t have it yet)
curl is required to download the Docker installation script. If you don’t have it, install it with this command:
sudo apt install curl -yStep 3: Install Docker (if you don’t have it)
If Docker isn’t installed yet, you can set it up quickly with this command:
curl -sSL https://get.docker.com/ | shWhen the installation finishes, check that everything works by running:
docker --versionIf you get a version number back, you’re ready to continue.
Step 4: Install Uptime Kuma with Docker
Here comes the exciting part: deploying Uptime Kuma as a Docker container. Run this command:
docker run -d --restart=always -p 3001:3001 -v uptime-kuma:/app/data --name uptime-kuma louislam/uptime-kuma:1What Does This Command Do?
-d: Runs the container in the background.--restart=always: Makes the container restart automatically when your system reboots.-p 3001:3001: Maps port 3001 inside the container to port 3001 on your host machine.-v uptime-kuma:/app/data: Creates a persistent volume to store configuration data and metrics.--name uptime-kuma: Names the containeruptime-kumaso you can identify it easily.louislam/uptime-kuma:1: Uses the official Uptime Kuma image, version 1.
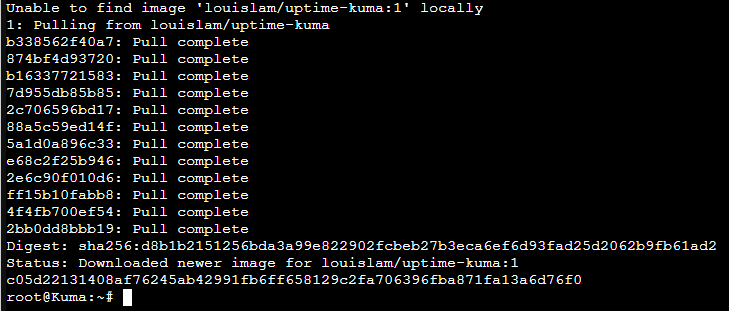
You should see something like this:
Step 5: Access Uptime Kuma
Open your browser and go to the Uptime Kuma interface at:
http://:3001
If you’re running it locally, just use:
http://localhost:3001
If you don’t know your IP address, run:
ip aIn our case it is:

From here you can set up your admin account, add monitors and start tracking your services.

Create your admin user, set a strong password and pick your language

You can now add monitors and start tracking your services.
Where to Go From Here
With Uptime Kuma up and running, here are a few suggestions to get the most out of it:
- Add monitors: Track websites, API services, TCP ports, ping and more.
- Configure notifications: Connect Uptime Kuma to messaging services like Telegram, Slack or your email.
- Explore metrics: Review the historical logs and the uptime of your services.
- Update Uptime Kuma: Keep up with new releases by simply removing and recreating the container:
docker pull louislam/uptime-kuma:1
docker stop uptime-kuma
docker rm uptime-kuma
docker run -d --restart=always -p 3001:3001 -v uptime-kuma:/app/data --name uptime-kuma louislam/uptime-kuma:1
And if you want to move to version 2
Everything above pins louislam/uptime-kuma:1 on purpose, which is why updating will not surprise you. But you should know that version 2 exists, stable since October 2025 and currently at 2.5.0, and that moving over is not just changing a number.
2.x ships breaking changes. The first time it starts on your data it runs a migration that reorganises the entire heartbeat table. In the official guide’s own example, 20 monitors with 90 days of history took around seven minutes; with more monitors or slower hardware it takes considerably longer. And the important warning: if that migration is interrupted there is no going back, you restore from backup and start over.
So the order is this, and the backup is not optional. The project itself puts it this way in its release notes: “Backup, backup and backup”.
# 1. Stop the container
docker stop uptime-kuma

# 2. Back up the volume BEFORE anything else
docker run --rm -v uptime-kuma:/data -v "$PWD":/out alpine
  tar czf /out/uptime-kuma-backup-$(date +%F).tgz /data

# 3. Recreate the container pointing at 2
docker rm uptime-kuma
docker run -d --restart=always -p 3001:3001
  -v uptime-kuma:/app/data --name uptime-kuma
  louislam/uptime-kuma:2

# 4. Watch the log and do NOT touch anything until it finishes
docker logs -f uptime-kuma
Two details that catch a lot of people out: 2.x requires Node 20.4 or newer if you are not using Docker, and rootless images are not recommended for the upgrade because they tend to fail on startup. If you are on one of those, switch to the regular image first.
And if you are in no rush, staying on 1 is perfectly reasonable: it still gets maintenance and it is what this tutorial installs.
Conclusion: Your Monitoring in Minutes

With just a handful of commands you now have Uptime Kuma installed and ready to use. No more worrying about downtime in your services. The tool is easy to install, efficient and highly customizable.
Questions or suggestions? Drop them in the comments and I’ll be glad to help.
Technical Detail:
- You can change the service port by editing
-p 3001:3001to whichever port you prefer.
Share this guide with your colleagues and friends. Together we can improve the way we monitor our services! 🚀
Remote access to Uptime Kuma
By default, Uptime Kuma is only reachable from your local network. To check on it from anywhere you have two options:
- Cloudflare Tunnel (recommended): expose Uptime Kuma without opening ports on your router, free and secure
- Nginx Proxy Manager: if you’d rather run your own reverse proxy with SSL
Keep the database from growing forever
Uptime Kuma stores every check it runs. At a 60 second interval with ten monitors that is 14,400 rows a day, and by default it deletes none of them. This causes no trouble in the first week: it causes trouble in month six, when the disk fills up and you have no idea why. Worth settling now that you have just installed it.
The Easy Method (Native Feature in Uptime Kuma)
Note: Recent versions of Uptime Kuma include native options for controlling data retention straight from the panel. You can now set how many days of historical data to keep and run a Shrink database to compact it.
Steps for the native method:
- Log in to Uptime Kuma and click the account icon in the top right
- Click Settings
- Click Monitor History.
- Set the retention in days to whatever suits you. For example, 30 days.
- If you want, click Shrink database to run VACUUM on SQLite. That compacts the database, clearing out the empty fragments.

That way you keep database growth under control without resorting to scripts or cron jobs.
Note: If your database was created after Uptime Kuma 1.10.0, AUTO_VACUUM is already enabled and you may not need the manual method at all. Knowing it, though, gives you a better feel for what happens under the hood and can come in handy in advanced scenarios.
The Granular, Detailed Method (Manual)
If for whatever reason you want finer control, or you’re on an older version of Uptime Kuma without the native options, you can fall back on the manual method below to manage data retention. It also helps if you need more flexibility in your settings, specific retention periods or extra actions.
1. Install SQLite
SQLite is the database engine Uptime Kuma uses. To interact with its database, install it by running:
sudo apt install sqlite3 -yThat gives you the commands you need to clean up and compact the database.
2. Create a Cleanup Script
Go to the directory where the Uptime Kuma database is stored:
cd /var/lib/docker/volumes/uptime-kuma/_data/Create a file called clean.sh with the following contents:
nano clean.shScript Contents:
#!/bin/bash

DB_PATH="/var/lib/docker/volumes/uptime-kuma/_data/kuma.db"

sqlite3 "$DB_PATH" <<EOF
DELETE FROM heartbeat WHERE time < datetime('now', '-1 year');
VACUUM;
.exit
EOF
Save the file and exit the editor (Ctrl+O, Enter, Ctrl+X).
What Does This Script Do?
DB_PATH: Defines the path to thekuma.dbdatabase.- Delete old records: Uses the
DELETE FROM heartbeatcommand to remove every row in theheartbeattable older than one year (datetime('now', '-1 year')). - Compact the database: Runs
VACUUM, which shrinks the physical file size by clearing out the empty fragments the delete left behind.
How Do You Change the Time Window?
- 1 month: Change
datetime('now', '-1 year')todatetime('now', '-1 month'). - 3 months: Use
datetime('now', '-3 months'). - 6 months: Use
datetime('now', '-6 months').
Tune this value to match your own data retention needs.
3. Make the Script Executable
So the script can actually run, change its permissions:
chmod +x clean.sh4. Schedule Automatic Cleanups with Cron
Set up a cron job so the script runs automatically. Edit the crontab:
crontab -eCron Job Configuration
Add the following line at the end of the file to run it every day at 2:00 a.m.:
0 2 * * * /var/lib/docker/volumes/uptime-kuma/_data/clean.sh >> /var/lib/docker/volumes/uptime-kuma/_data/clean.log 2>&1What Does This Cron Job Do?
0 2 * * *: Schedules the script to run every day at 2:00 a.m./var/lib/docker/volumes/uptime-kuma/_data/clean.sh: The path of the script to run.>> /var/lib/docker/volumes/uptime-kuma/_data/clean.log: Redirects standard output (the script’s normal results) to theclean.logfile, keeping a history of every run.2>&1: Redirects errors, if there are any, to that sameclean.logfile so you can review anything that went wrong.
How Do You Check the Logs?
You can review the script’s run history with:
cat /var/lib/docker/volumes/uptime-kuma/_data/clean.logHow Do You Change the Frequency?
- Run every hour: Change
0 2 * * *to0 * * * *. - Run every week: Use
0 2 * * 0. - Run every month: Use
0 2 1 * *.
Save and close the file (Ctrl+O, Enter, Ctrl+X).
Extra Options to Improve Maintenance
Use Nginx Proxy Manager to Reach Uptime Kuma
If you’d rather not expose Uptime Kuma’s internal port directly, or open a specific port for every service, adding Nginx Proxy Manager may be the answer. This reverse proxy lets you funnel traffic through the standard ports (80 and 443) you already have open, which adds a layer of security and simplicity. On top of that, you can set up SSL certificates easily, centralize access to several applications and keep a tidier environment.
To learn how to install it, take a look at our post on how to install Nginx Proxy Manager on Docker.
Run Uptime Kuma in a Virtualized Environment
If you’d rather deploy Uptime Kuma in a virtual machine or an LXC container, Proxmox VE is an excellent option. It lets you create and manage isolated environments efficiently. To learn how to install it, see our guide How to Install Proxmox VE from Scratch: A Step-by-Step Guide, and if you want to dig into the fundamentals of virtualization, check out Proxmox from Scratch: The Complete Guide to Getting Started with Virtualization on Proxmox VE.
Next steps
Over time the Uptime Kuma database can grow quite a bit. Learn how to control data retention and optimize performance in our dedicated guide.